Connector Traces
Overview
When configuring Connectors in Bizagi, you may rely on several features for error control and diagnostics.
One of these features is the use of Traces whenever you detect there is an issue with the execution of the connector and you wish to retrieve further detail.
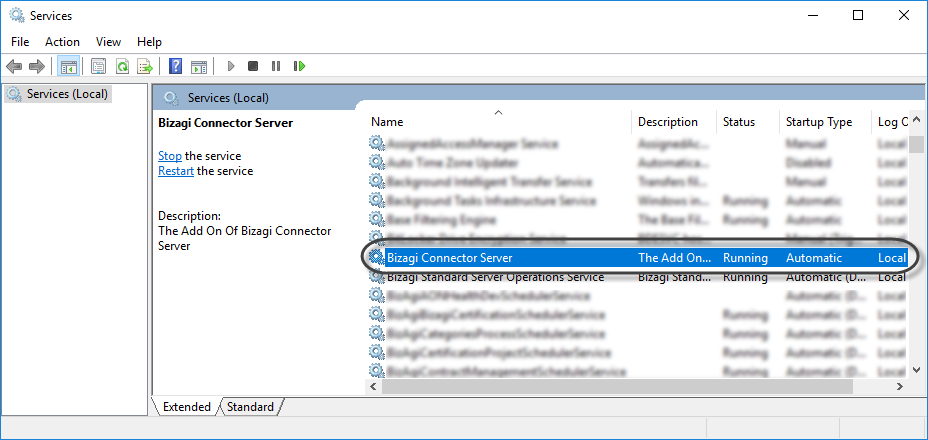
Before tracing your connectors, make sure that the Bizagi Connector Service is up and running. Otherwise, the connector does not run, and thus, it does not generate traces.
Connector Traces
Whenever you are debugging a Connector's execution (in Development environments) or whenever you wish to retrieve further detail about a failed execution, you may choose to turn on the External connectors traces.
Note:
Keep in mind that Connectors traces can be enabled anytime, but it is strongly recommended to enable them temporarily only when needed (and afterwards, disable them).
Changes in this configuration will most likely require a reset in your Bizagi server's services.
Enabling these traces is useful to track down, after an error in the application, the exact point where said error has happened. There are five points where detail is logged and you may diagnose if there is a problem when executing your Connector, or whenever transformations were being applied to the information.
Types of Traces
The following traces are logged as detailed in the table below:
| Chronological Order | Trace Type | Description |
|---|---|---|
| 1 | Inputs | Leaves a JSON file with the inputs sent to the Connector before the execution of its logic. Its name has the following convention: [timestamp]_[case_identifier]_IN0_[Connector name]_[action name].json. Note that timestamp is set as yyyyMMddHHmmss. |
| 2 | Inputs Transformed | Leaves a JSON file with the inputs sent to the Connector after the execution of its logic. Its name has the following convention: [timestamp]_[case_identifier]_IN1_[Connector name]_[action name].json. Note that timestamp is set as yyyyMMddHHmmss. |
| 3 | Outputs | Leaves a JSON file with the outputs received from the external system before any transformation done by Bizagi. Its name has the following convention: [timestamp]_[case_identifier]_OU0_[Connector name]_[action name].json. Note that timestamp is set as yyyyMMddHHmmss. |
| 4 | Outputs Transformed | Leaves a JSON file with the outputs received from the external system after all transformations done by Bizagi. Its name has the following convention: [timestamp]_[case_identifier]_OU1_[Connector name]_[action name].json. Note that timestamp is set as yyyyMMddHHmmss. |
| 5 | Connector Logic | Leaves four .log files: Connector log ([connector name].[connector name].log), Service logs (bz-facade.log, facade-exceptions.log, and [connector name]-bz-ctrl.log). Note that timestamp is set as yyyyMMddHHmm. |
Additional Measure Oriented to Error Control
It is strongly recommended that you also define the service's expected time, so that you can explicitly assign both: a timeout for the service, and a logging threshold.
- Logging Threshold Parameter: Alerts you about those interfaces whose invocations are delaying more than expected (more than usual).
- Timeout Definition: Thrown in a service invocation if the service delays more than its timeout definition.
For asynchronous activity services, the timeout definition is taken from the minimum time set either for the asynchronous task or for the specific interface.
How to Trace Your Connector?
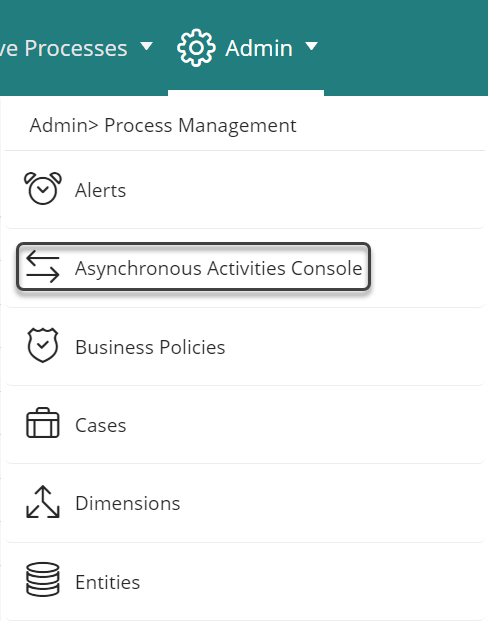
1. Detect the Error
As a most common practice, you may find that your connector is invoked from an Asynchronous Activity. If the invocation fails, further error detail can be viewed from the Admin menu, in the Asynchronous Activities console option.
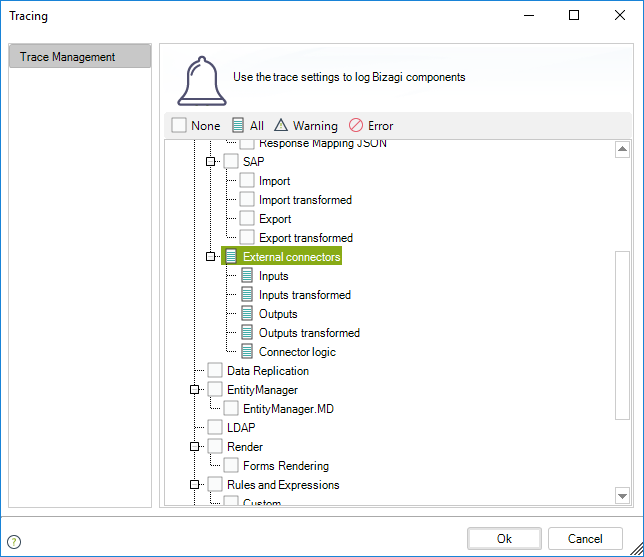
2. Setup the Traces Configuration
Through the Tracing options, enable all of the Interfaces traces.
3. Re-run the Interface Invocation (to Log the Error Detail)
Retry the invocation of the interface from the Asynchronous Activities Console to have a log with detail. Then, browse into your Bizagi Server and into the Connectors traces folders:
.NET Example:
C:\Bizagi\Projects\[project_name]\Temporary\Connectors
C:\Program Files\Bizagi\Bizagi Studio\ConnectorsService\framework\Logs\Connectors\[project_name]
Note:
Not all files may be recorded. For instance, if an error occurs in the transformation of inputs, only the first file (Inputs) will appear because the error occurred before the transformation was made.
4. Validate the Traces to Identify the Error
Validate the information contained in these traces.
Service Connector Monitor
When you install Bizagi, a Windows scheduled task is installed alongside the Connector service. This task monitors the activity of the Connector service and logs if the service is running. If not, the task tries to reset the service.
Scheduled Task
When you open the Task Scheduler in the Windows server where Bizagi is installed, you can find the Connector Monitor folder in the Task Scheduler Library.
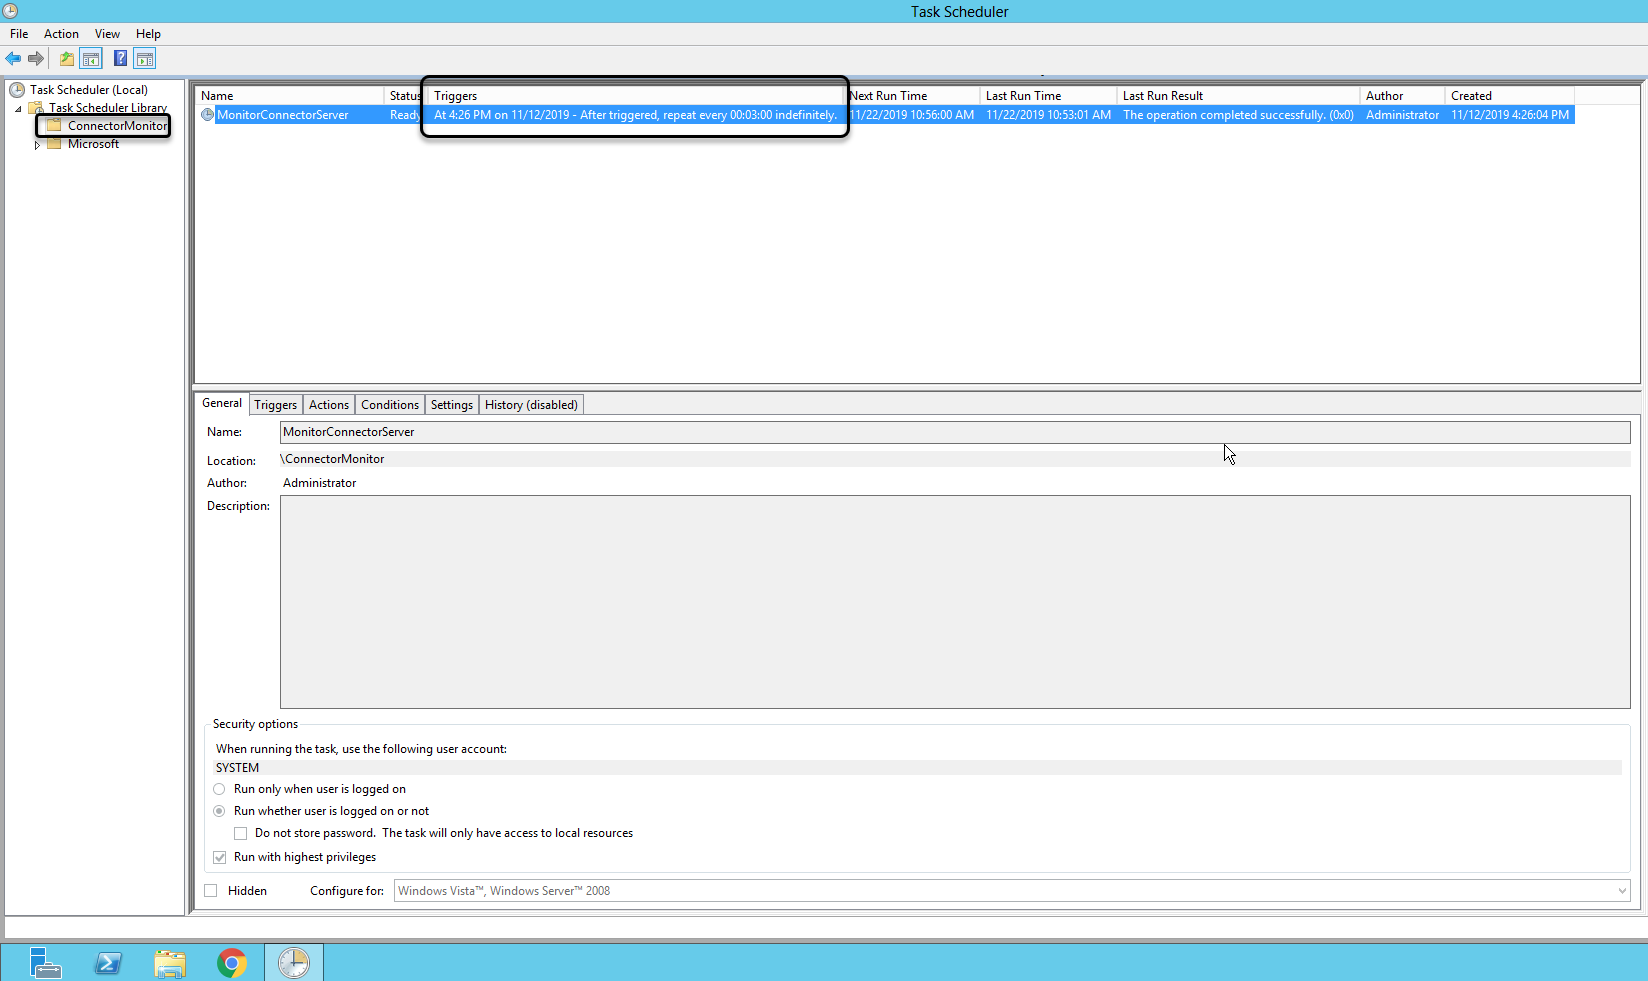
This task executes a dummy connector to verify that the Connector service is up and running correctly. It is set to execute every three minutes.
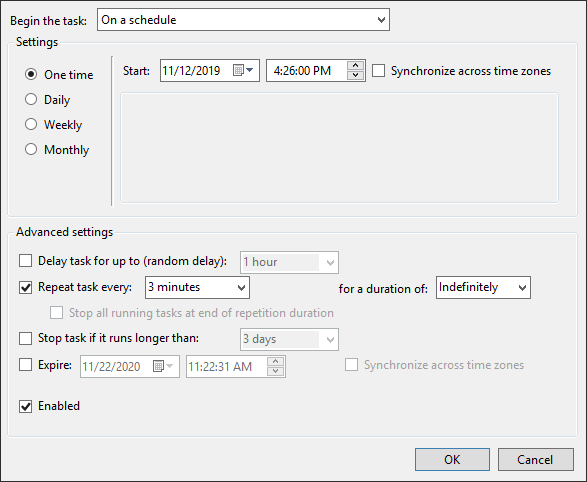
Note:
We do not recommend reducing the repetition time as it can affect the performance of the Connector service.
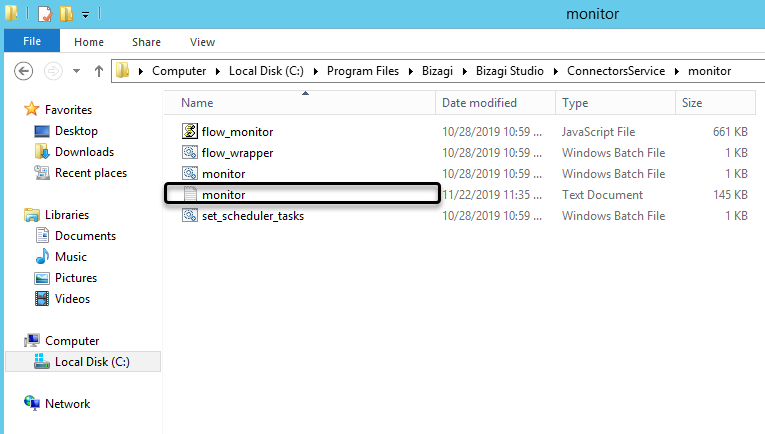
Logs Location
The logs associated with this task are stored in the following paths:
- Bizagi Studio:
C:\Program Files\Bizagi\Bizagi Studio\ConnectorsService - Bizagi Engine:
C:\Program Files\Bizagi\Engine\ConnectorsService
Here you find the file Monitor.text:
Connectors in Bizagi rely on the Node.js framework, so it is important to monitor not only the Windows service but also the framework's functionality. This task executes two monitor tasks:
- Reviews the status of the Connector Windows service.
- Reviews the status of the Node.js framework.
Each record in the Monitor log has the following structure:
- Time Stamp: WeekDay
dd/mm/yyyy HH:mm:ss:ms - Component:
Monitor.bat(Windows service request result) orFlow monitor.bat(Node.js framework request result).