ECM Traces
Overview
When configuring ECM integration in Bizagi, you may rely on the use of traces for error control and diagnostics.
Traces let you detect whenever there is an issue with the ECM integration and retrieve further detail.
ECM Traces
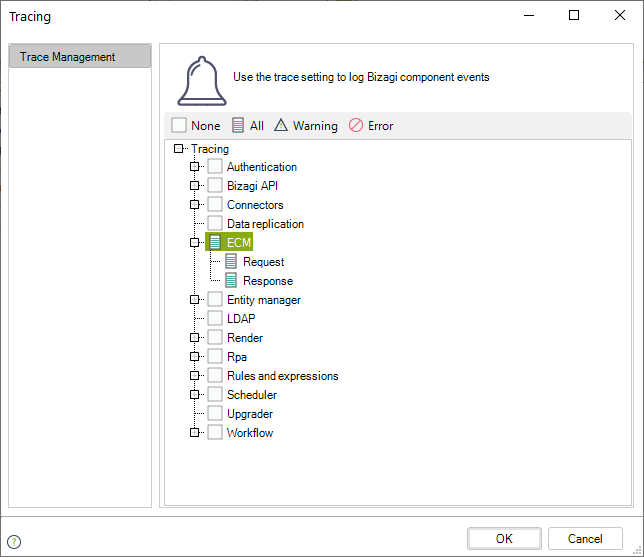
Whenever you are debugging an ECM integration (in Development environments) or whenever you wish to retrieve further detail about a failed integration, you may choose to turn on the ECM traces.
Note
Keep in mind that ECM traces can be enabled anytime, but it is strongly recommended to enable them temporarily only when needed (and afterwards, disable them).
Changes in this configuration will most likely require a reset in your Bizagi server's services.
Enabling these traces is useful to track down, after an error during the integration, the exact point where said error has happened. There are three points where detail is logged and you may diagnose if there is a problem with the integration with your ECM system.
Types of Traces
The following traces are logged with a chronological order, as detailed in the table below:
| Chronological Order | Trace Type | Description |
|---|---|---|
| 1 | Log | Leaves a log file with the error log during the integration with your ECM system. |
Name convention: [timestamp]_ECM.log | ||
| Timestamp format: YYYYMMDD | ||
| 2 | Request | Leaves an XML-formatted file with the message sent to the ECM system. |
Name convention: [timestamp]_[OperationID]_[ServiceName]_request.log | ||
| Timestamp format: YYYYMMDD | ||
| 3 | Response | Leaves an XML-formatted file with the response associated with the same OperationID and ServiceName. |
Name convention: [timestamp]_[OperationID]_[ServiceName]_response.log | ||
| Timestamp format: YYYYMMDD |
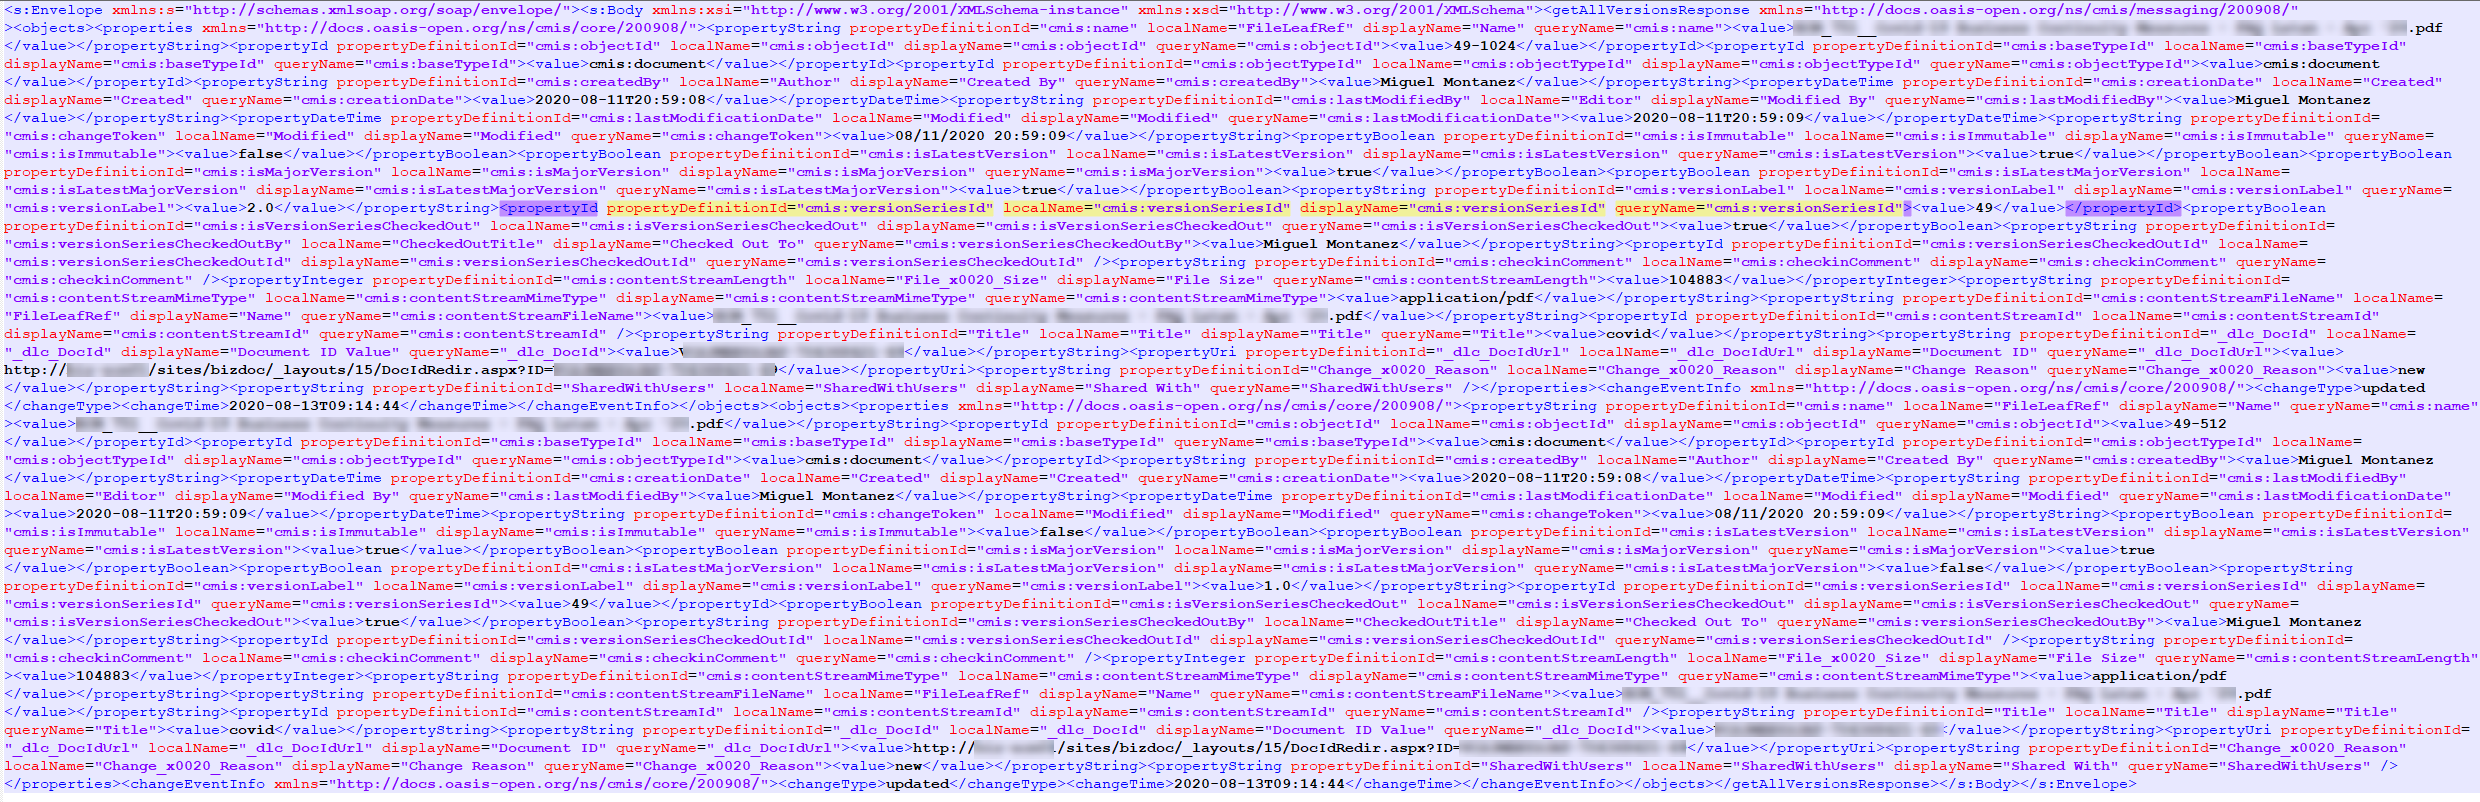
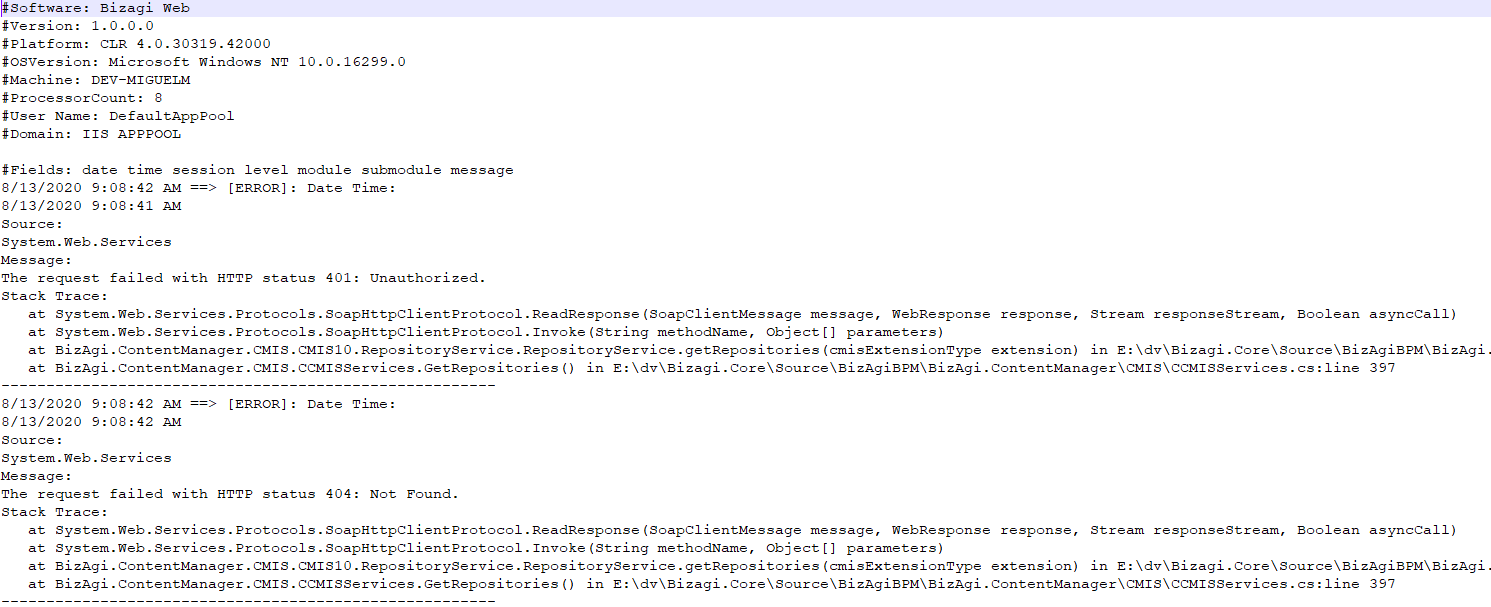
The following images show an example of the generated log files.
Log File
Request Log File

Response Log File