RPA Traces
Overview
When configuring RPA invocations in Bizagi, you may rely on the use of traces for error control and diagnostics.
Traces let you detect whenever there is an issue with the RPA invocation and retrieve further detail.
RPA Traces
Whenever you are debugging an RPA invocation (in Development environments) or whenever you wish to retrieve further detail about a failed invocation, you may choose to turn on the RPA traces.
Note:
Keep in mind that RPA traces can be enabled anytime, but it is strongly recommended to enable them temporarily only when needed (and afterwards, disable them).
Changes in this configuration will most likely require a reset in your Bizagi server's services.
Enabling these traces is useful to track down, after an error in the application, the exact point where said error has happened. There are five points where detail is logged, and you may diagnose if there is a problem with your bot's invocation, or whenever transformations were being applied to the information.
Types of Traces
The following traces are logged with a chronological order, as detailed in the table below.
| Chronological Order | Trace Type | Description |
|---|---|---|
| 1 | Request | Leaves a JSON file with the inputs sent to the robot before the execution of its logic. Its name follows this convention: [timestamp]_[case_identifier]_Input_[RPA_vendor]_[RPA_Process_name].json. Timestamp format: yyMMddHHmmss. |
| 2 | Request Transformed | Leaves a JSON file with the inputs sent to the robot after the execution of its logic. Its name follows this convention: [timestamp]_[case_identifier]_Input Transformed_[RPA_vendor]_[RPA_Process_name].json. Timestamp format: yyMMddHHmmss. |
| 3 | Response | Leaves a JSON file with the outputs received from the robot before any transformation done by Bizagi. Its name follows this convention: [timestamp]_[case_identifier]_Output_[RPA_vendor]_[RPA_Process_name].json. Timestamp format: yyMMddHHmmss. |
| 4 | Response Transformed | Leaves a JSON file with the outputs received from the robot after all transformations done by Bizagi. Its name follows this convention: [timestamp]_[case_identifier]_Output Transformed_[RPA_vendor]_[RPA_Process_name].json. Timestamp format: yyMMddHHmmss. |
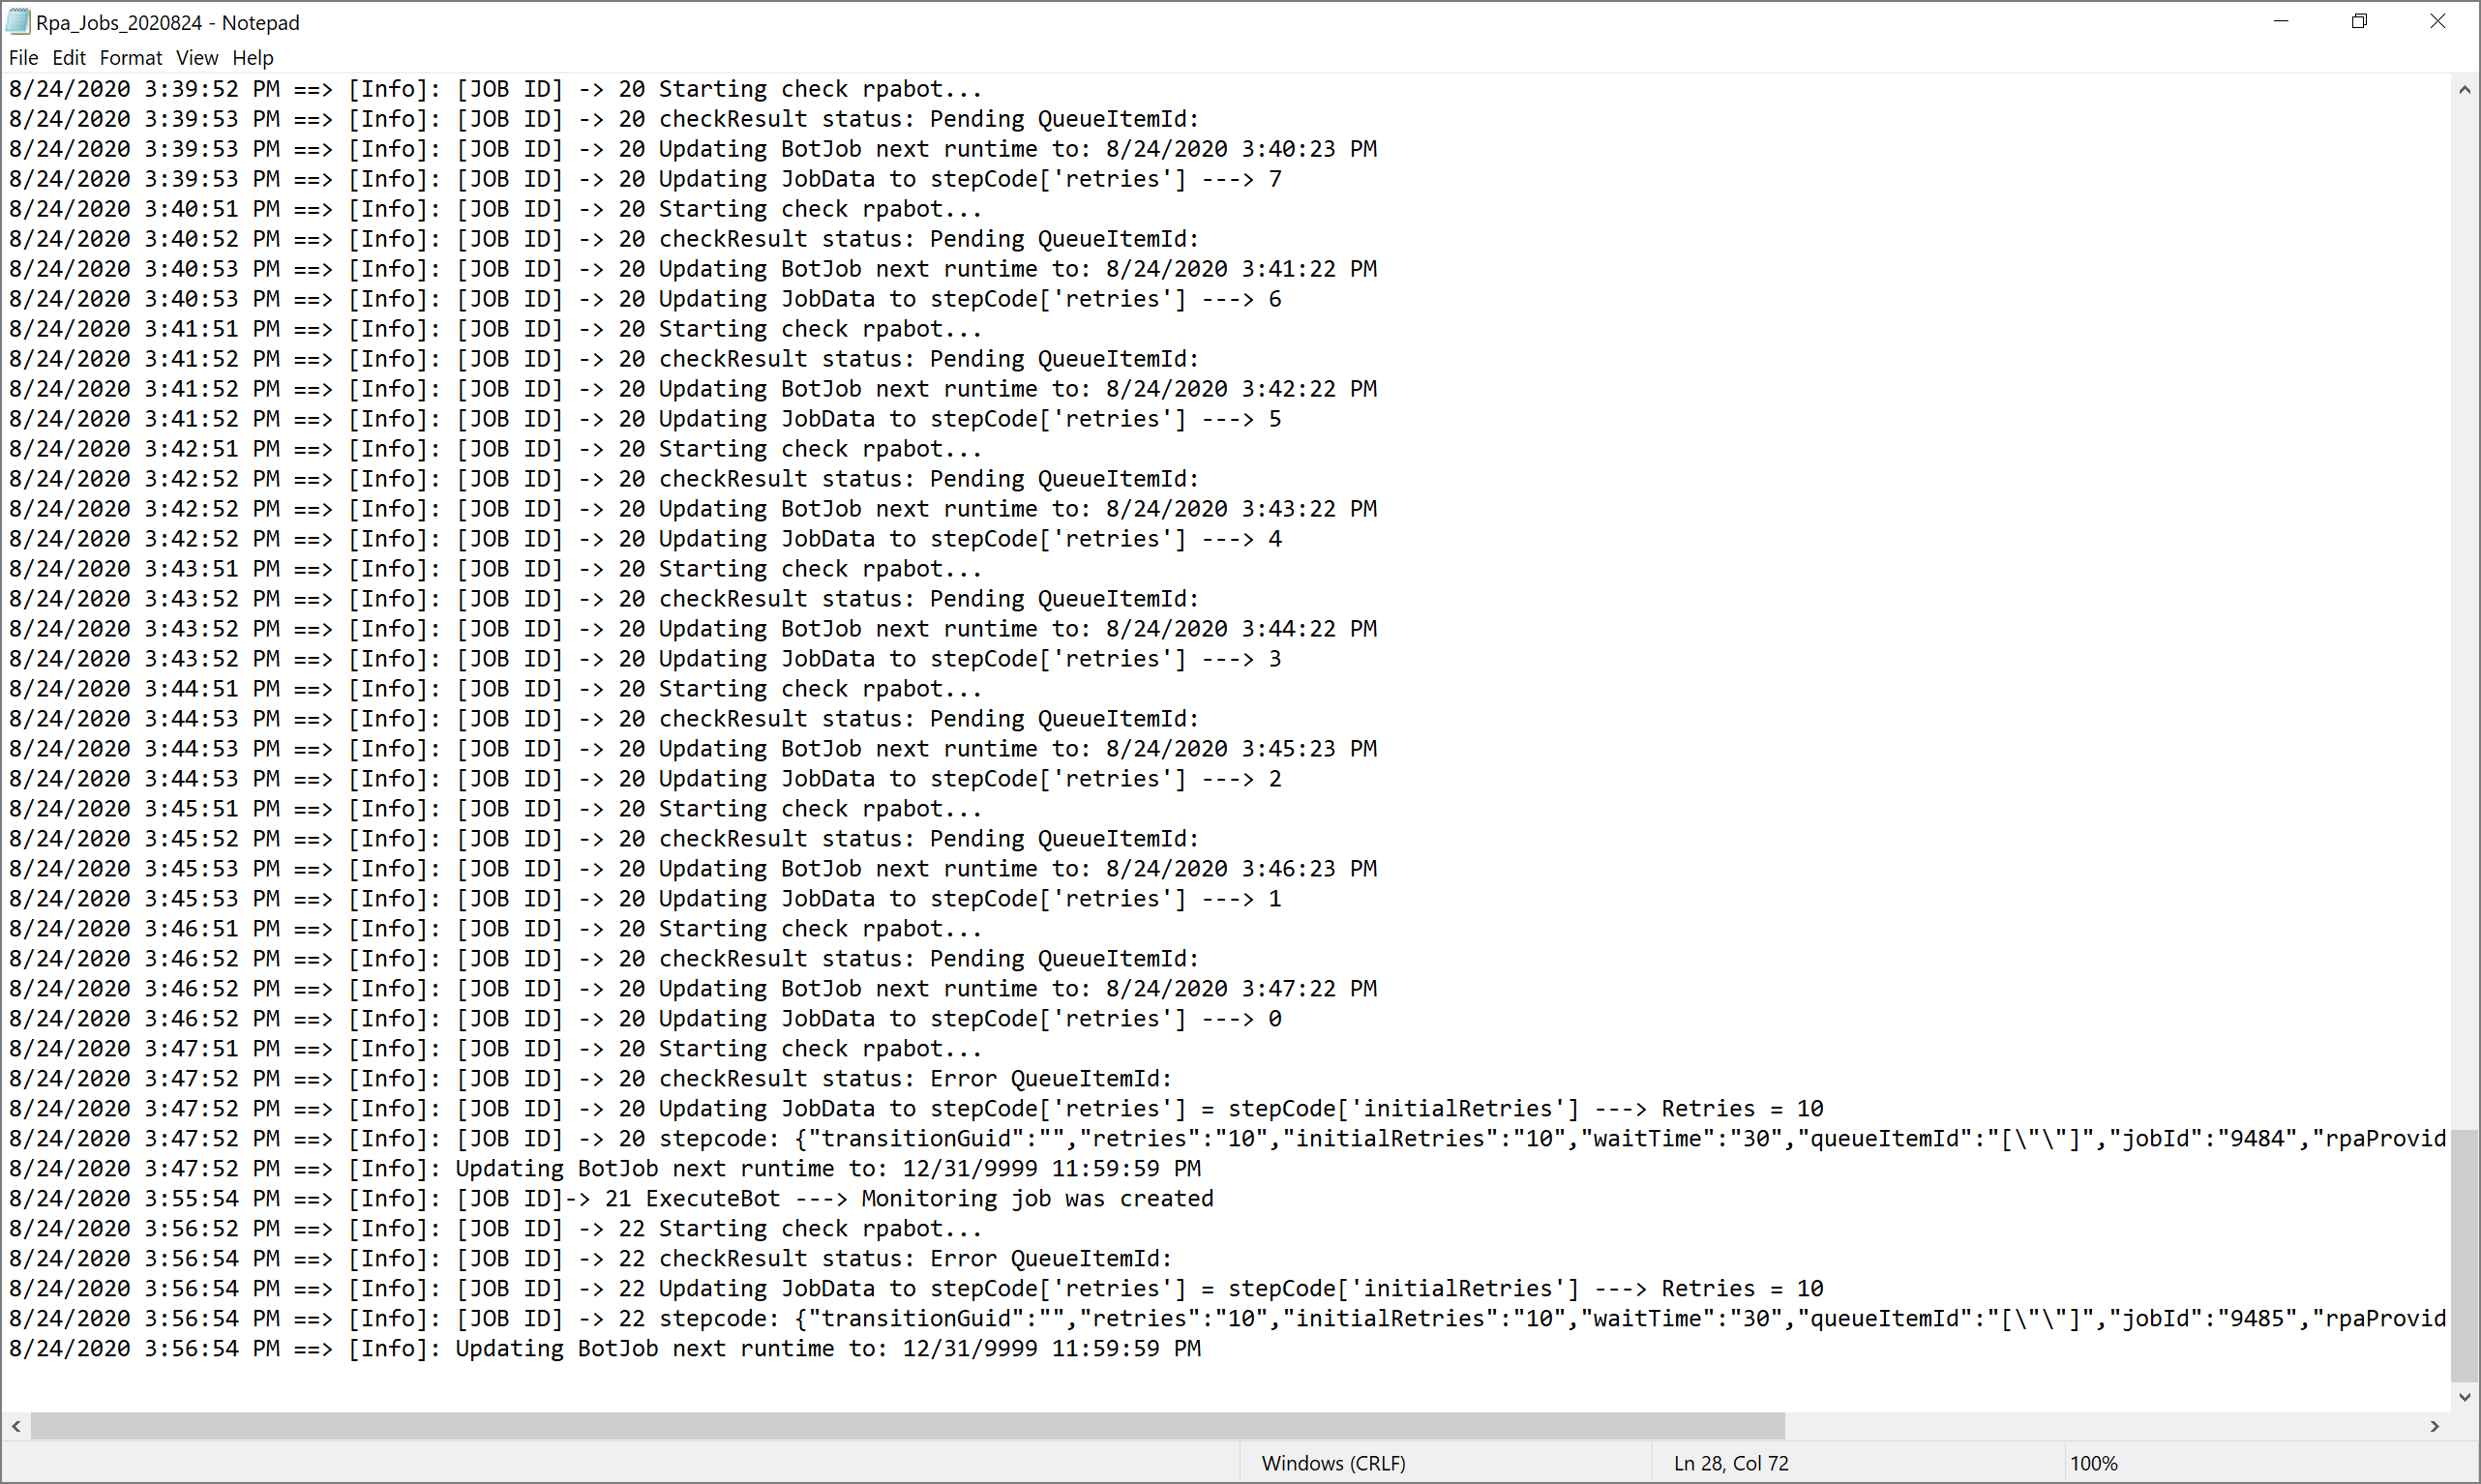
| 5 | Monitoring Jobs | Leaves the basic information of the monitoring of a job, including start time, status check, retries remaining, and next execution date. Its name follows this convention: Rpa_Jobs_[date].log. Date format: yyyyMMdd. Note: Leading zeros for month and day may be omitted. |
How to Trace Your RPA Execution?
Follow these steps to detect and diagnose issues in RPA invocations:
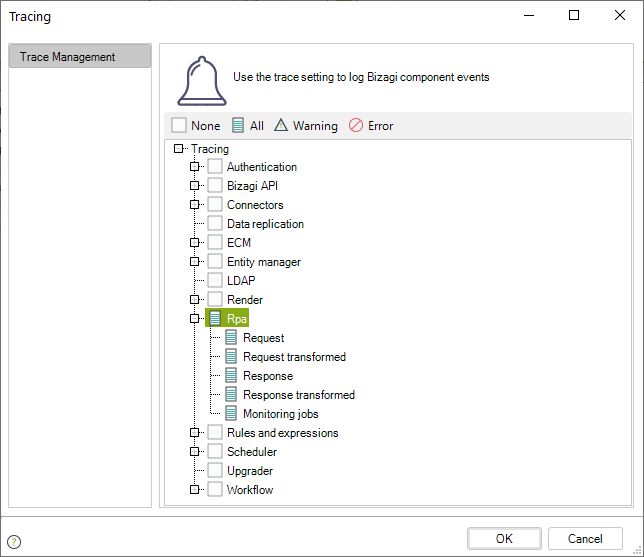
1. Setup the Traces Configuration
Through the Tracing options, enable all of the Interfaces traces.
2. Re-run the Bot Invocation (to Log the Error Detail)
- Go to the Management Console or the Asynchronous Activities Console and retry the invocation of the bot to generate a detailed log.
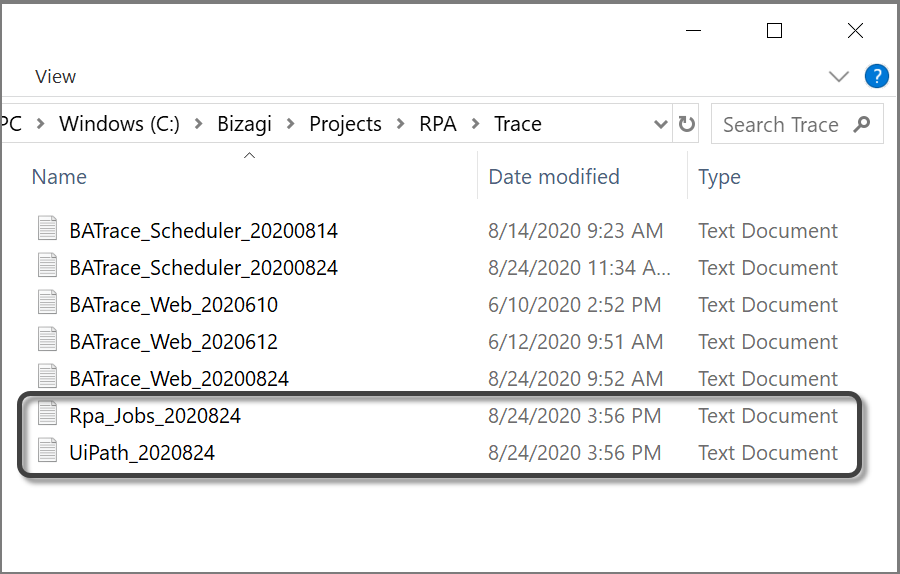
- Browse into your Bizagi project server and locate the RPA logs. In this .NET example, the location is:
C:\Bizagi\Projects\[project_name]\Trace.
In this folder, you will find the Monitoring jobs file and the log file of your robot.
Note:
It is important to note that not all files may be recorded in every case. For example, if an error occurs during data extraction from Bizagi, only the first file (Request mapping) will appear because the error happened before the request was made.
3. Validate the Traces to Identify the Error (One by One)
- Validate information contained in these traces. The Monitoring jobs file shows the robot's attempts to execute the task and the errors recorded.
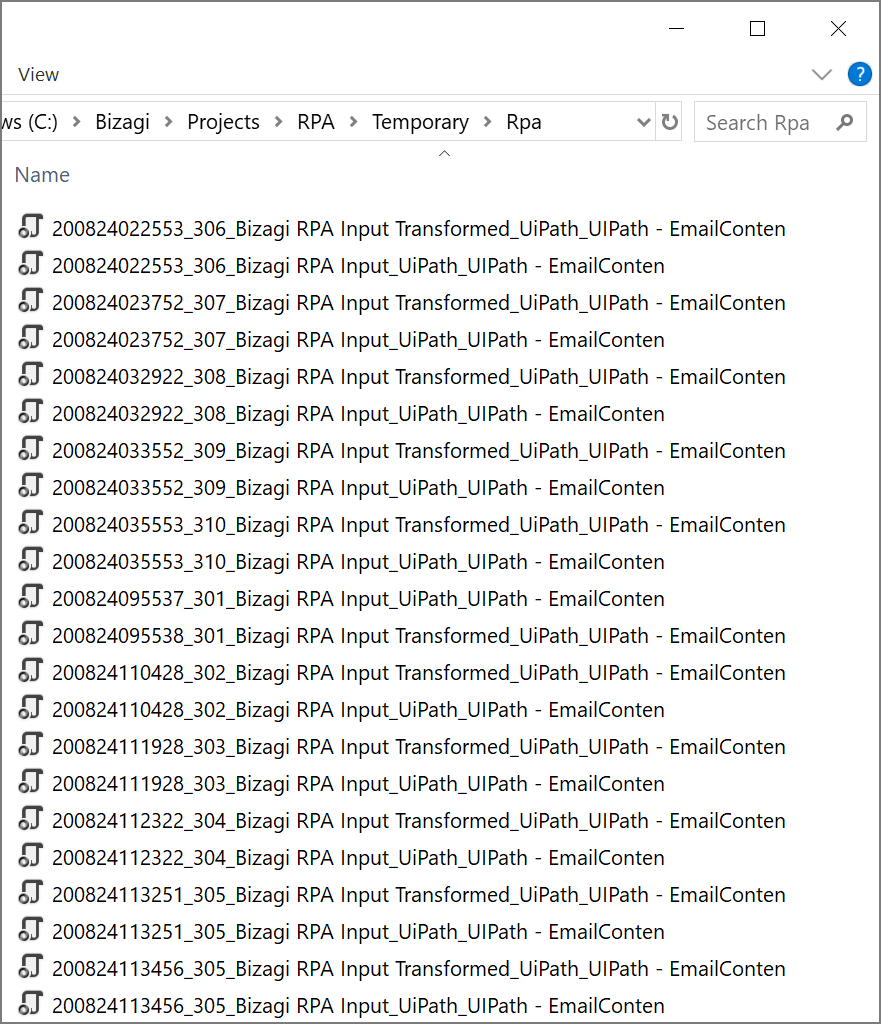
- If the error concerns the inputs sent to the robot, check the Request file in the path:
C:\Bizagi\Projects\[project_name]\Temporary\Rpa.
Note:
It is important to note that not all files may be recorded in every case. For example, if there is an error with the inputs sent to the robot, only the first two files (Request and Request Transformed) will appear because the error occurred before receiving a response from the robot.